 If you would like to contact Leo or have a support question, please use this form, or send an email to
Delivering the Stock Market to Excel
XLQ2 - Tips and Tricks
This page will continue to be expanded, to become a quick reference guide to everything useful using xlq with excel regardless of experience or knowledge.
If you think something should be included or changed, have any suggestions or something to contribute, send me an email
Quick Links
Click below for more info:
You may download the latest version of xlq from here: https://www.qmatix.com/XLQ_Download.htm.
If you plan to use xlq with excel you must download the same 32 / 64 bit version, i.e. only xlq32 bit can be used with 32 bit excel, and 64 bit xlq with 64 bit excel. You can verify the version of excel via the excel about dialog (more info on download page).
If the wrong version is downloaded, you can uninstall xlq then re-run the correct installation.
Once downloaded, run the install program (which may require a reboot if the c++ runtimes are updated).
You are now ready to begin using xlq, usually by opening the sample spreadsheets.
XLQ will start automatically if excel uses it so the simplest way to use xlq is to open an existing spreadsheet containing formulae or type one in
e.g. if you type in =xlqprice("msft") into a cell and press enter xlq will be started, the data requested and the cell will update.
You may also open the sample spreadsheets (all found in the program files directory where xlq is installed, usually C:\Program Files\QMatix\xlq or C:\Program Files (x86)\QMatix\xlq if running 32 bit xlq on 64 bit windows.
- The following sample spreadsheets are available:
- xlqDemo.xlsb - This will be your main reference with lists of all general formulae available along with examples of each.
- xlq2Demo.xlsb - Contains more specialized formulae supported in xlq2, such as for dividends, financials, earnings, insider transactions, or for extra formulae covered by EODHD, FMP, Norgate, Schwab etc. (If using xlq2Lite you may view the xlsb for an idea of what is available but the formulae will not work.)
- xlq2AccountDemo.xlsb - Contains all formulae and examples for working with data for accounts and positions from your brokerage account.
- xlq2ExtraChartsDemo.xlsb - provides additional chart examples, including using historic intraday and scrolling charts.
- xlqCryptoCurrencies.xlsb - extra formulae and examples for crypto currencies for working with data sources such as Coinmarketcap, EODHD, FMP, Interactivebrokers, Tiingo or Yahoo.
- aaiiDemo.xlsb - provides a list of all fields available if subscribed to AAII stock investor pro, along with examples of their usage.
- xlqaaii custom formulae.xlsb - extra formulae supported in xlq2, calculating values on underlying aaii stock investor pro data.
- aaiiMacro.xlsm - an example showing how to use xlq with a VBA macro, in this case looking for results from aaii stock investor pro, writing the results to cells.
When xlq is running a Q is shown on the windows task bar next to the date / time which shows the status and provides access to settings, logs and views of all underlying data.
It will be there if started by another program (excel / xlqCompanion), but may be started directly (click windows start and type in xlqe, for xlqengine and you may select it.
If xlq is started by another program, it will shutdown once the last program has stopped using it. If xlq is started on its own, any program will connect with it, during which time you cannot close it, any may exit it once all connections are closed.
If you cannot see the Q windows may be hiding it and it is recommended to drag it into view as shown below.
You may also display the menu by pressing alt-ctrl-shift-Q
From the menu you may choose About to enter your registration or xlq2 trial code
If using a subscription source you would need to enter your details and preferences under data source specific
You should also spend some time looking at the different views as underlying data will be shown here, and the status views will help in solving any problems.
To see all available views etc. you would need an xlq2 license.
This covers the basics you should know to get the most out of xlq / excel.
xlq formulae are exactly the same as standard Excel formulae, i.e. the same rules apply
To indicate you are entering a formulae = is used followed by the name
of the formula with the list of parameters enclosed in brackets
e.g. =xlqPrice("msft") or =xlqPrice("aapl","xlq2") - if you do not provide all parameters, default values are used, i..e the first will use the
default source as set in xlq preferences.
Parameters may be entered directly into the formula or referenced in another cell
When entering parameters directly in a formulae string values are entered in quotes, and number directly. Dates are also entered in quotes (if not they are treated as a calculation "1/1/22" = 1 January 2022, 1/1/22 = 1 divided by 1 divided by 22). A formulae may also be entered as a parameter in which case the results of that value are passed.
When reference in another cell, the result of the cell is used and can be string, number or another formula
To find a formula name you can use the demo spreadsheets as a reference, or the resource menu on the website
You may also use autocomplete, i.e. as you type the formula into an excel cell it will propose a list that match (see image in 'formulae and parameters' above.
You may also use excels Fx button (or press shift-F3) and browse to the formulae you want. Once selected required parameters are shown, along with descriptions
if the formula is already entered in the cell using Fx will take you directly to parameter help
How the results of a formulae are shown will depend on the formatting of the cell.
Basic formatting will show thousand separators, number of decimals, date layout, and can also cover color, fonts, and text orientation
There are multiple ways to format a cell, from clicking on the tool bar, to using the formatting dialog (shortcut ctrl-1)
The format painter may also be used to quickly format cells based on an existing one.
It is also possible to create custom formatting when needed.
When a cell is referenced in a formula, e.g. =xlqprice(A1), it is considered relative, i.e. if the cell is copied down 1 row the reference will automatically refer to B1, or copied to the right. will refer to A2
To make the reference absolute $ is used. Wherever =xlqprice($A$1) is copied to it will always refer to A1
It is also possible to make only the column absolute ($A1), or the row (A$1).
To toggle absolute / relative you may press F4
Correctly specifying absolute / relative references when a formula is entered allows for faster editing of a sheet afterwards by copy / pasting or dragging cells.
Using Copy / Paste
You may also Use ctrl-C to copy ctrl-V to paste, and ctrl-H to show the replace dialog
Dragging cells
All xlq formulae start with =xlq.
Formulae from a day source, i.e. real-time or delayed will be simply xlqPrice, xlqBid, xlqName etc.
For historic data the formulae will begin with xlqh, i.e. xlqhClose, xlqhDate, xlqhOpen etc. for daily data
Most historic formulae will also have weekly (W) or monthly (M) equivalents, i.e. xlqhwClose, xlqhmDate etc.
Many calculations are also applied as data is retrieved based on predefined parameters set in xlq preferences, and are called in the same way e.g. xlqhADX, xlqhwRSI etc.
Historic calculations also have an xlqXh variant that allow you to specify all additional parameters to calculate over different time frames etc. on the fly with (also with Weekly and Monthly variants) i.e. xlqxhADX, xlqxhwRSI etc.
Range formulae (xlqRh xlqrhw, xlqrhm)are also available returning the results between 2 dates, e.g. xlqrhHighestClose etc.
All historic calculation and range formulae are also available for x minute intraday
analysis via the historic intraday formulae xlqxhi.. and range xlqrhi.
These formulae work with additional parameters to specify the date, time, interval and whether to work with market hours data or
also include extended hours.
Other data may also be returned from an historic source, such as statistics, upcoming events etc. These will also begin with xlqh and the sample spreadsheets should be consulted for full lists.
Parameters
The order of parameters are also standard, with the most basic being symbol, source, if parameters are not supplied, the defaults are used
e.g. =xlqprice("msft") will use the default source, and in this case the xlq2 source is specified =xlqNextEarningsDate("tsla", "xlq2")
For xlqh, xlqhw, xlqhm formulae the parameter order is symbol, date, source, i.e. xlqhclose("msft",-1) using the default source and prior close, or xlqhRSI("aapl","2/2/22","tda") using TDAmeritrade for 2nd February 2022
For xlqxh formulae etc the order is symbol, data, extra parameters..., source e.g. =xlqxhBollingerBandsMiddle("nflx",-1,20,2,0,"norgate-us") will return the middle Bollinger Band for last close for Netflix over 20 periods and a standard deviation of 2, based on close from Norgate.
For Range (xlqrh) it is symbol. from date, to date, source, i.e. =xlqrhHighestCloseDate("ZM","1/1/22",-1,"yahoo") will return the date of the highest close since 1 January 2022 and last close.
If using the historic intraday the above examples could be expanded
=xlqxhiBollingerBandsMiddle("nflx",-1,1130,3, 0, 20,2,0,"IB") would return the
middle BB for prior trading day at 11am for a 3 minute interval calculated on market hours data only.
=xlqrhiHighestCloseDate("ZM","2/21/23",930,"2/23/23",1500,1,1,"IB") would return the date / time for the highest close between 21 Feb 9:30 and 23 Feb 15:00 based on a 1 minute interval and included
extended hours.
Wrapper Functions
An exception applies to the wrapper functions (xlqFx and xlqFxStatic) which allow all xlq formulae to be passed as a parameter. The order of parameters will always be Formula name, symbol, source, extra parameters so the same cell references could be used for example for =xlqFx("xlqname","meli","iqfeed") requiring no extra parameters and =xlqFx("xlqhclose","meli","iqfeed",-1) requiring a date, and =xlqFx("xlqxhRSI","meli","iqfeed",-1,14) also requiring the number of periods.
#Source
#Source is for advanced users. It is similar to xlqfxStatic wrapper but may be used with standard formula by adding a # before the source.
May be used to optimize updating if the data is already available and the request keeps changing due to a volatile parameter.
e.g. =xlqhOptionContractName("aapl",TODAY()+30,xlqPrice("aapl","schwab")*100,1,"#schwab") will return the closest option put symbol based on current price (equal or less) for an expiry date around 30 days (or less) from the current day.
As xlqprice will force the results to be updated for both formulae using # for xlqhOptionContractName in this case will be more efficient. (if you are not sure, do not use the #).
In excel dates are simply a number representing the number of days since 1 January 1900 (date limit) so 1 = 1 Jan 1900, 2 = 2 Jan 1900 and 44562 = 1 Jan 2022.
Time is the fractional part of a number, i.e. midday on January 1 2022 would be 44562.5. Likewise 1 hour would be 1/24 or 0.041667, so 2am would be 44562.08333
The actual date / time shown in a cell would depend on the cell formatting, regional settings etc.
If A1 contained 1 Jan 2022, =xlqhclose("msft",A1) would be the same as =xlqhclose("msft",44562) or =xlqhclose("msft,"1/1/2022") When a date is entered directly as a parameter it needs to be in quotes to avoid it being treated as a calculation
When an exact date is passed as a parameter xlq will return the value for that date, or the prior date if it falls on a holiday or weekend so =xlqhclose("msft,"1/1/2022") would actually return the data for 31 December 2021.
To avoid needing to know if the market was open you can work with relative dates instead, where -1 is last close, -2 the trading day before etc.
There are also helper functions to determine the relative date from an actual date to work with a series in the past. See xlqdemo.xlsb for examples and full list.
When working with relative dates and basic historic functions or calculations (xlqxh formulae etc.) it is also possible to specify a date of 0 to use data from the day source and continue the calculation up to last price, i.e. =xlqhclose("msft,0) is the same as =xlqprice("msft") and =xlqxhCCI("msft",0,20,"ib") will calculate the 20 day commodity channel index up until last trade compared to -1 being last close.
For weekly formula any day within the week may be used as reference, and -1 refers to the current partial week. xlqhwdate will return the Monday data for the week referenced.
Same for monthly with xlqhmdate returning the fist of the month referenced and -1 being the current partial month
The same concept applies for data containing future dates, such as EODHD earnings or options, where -1 will be the end date of series, i.e. the most in the future, -2 the one before etc.
There are also 'valid date or next' formulae which will return the following valid date in a series if the date is not valid, rather than the prior.
It is possible to use xlq with VBA either calling the formulae in VBA functions and procedures, or running a vba routine controlling results in cells via xlq functions.
When using xlq formulae with VBA the xlqfxstatic wrapper should be used as it bypasses cell updating optimizations and allows for updating to be controlled by VBA.
e.g. a basic custom function MyxlqPrice calling xlqPrice with the supplied parameter would look like this:
Public Function MyxlqPrice(symbol As String)
    MyxlqPrice = Run([xlqFxStatic], "xlqPrice", symbol, "iqfeed")
End Function
The next example is a little more complex. It is not a recommended use but covers different topics
Public Declare PtrSafe Sub Sleep Lib "kernel32" (ByVal dwMilliseconds As LongPtr)

Sub KeepLooping()
    Sheets("Sheet1").Select
    Range("A1") = "=xlqFxStatic(""xlqprice"",""BTC.USD[PAXOS,CRYPTO,USD]"",""ib"")"
    Dim Price As Double
    Do While True
        Application.CalculateFull
        Price = Range("A1")
        If (Price < 31000) Then
            Range("B1") = "Below 31000"
        Else
            Range("B1") = "Above 31000"
        End If
        If (Price < 30000) Then
            MsgBox "Alert Low Reached"
            Exit Do
        ElseIf (Price > 32000) Then
            MsgBox "Alert High Reached"
            Exit Do

        End If
        Sleep 10000 'i.e. 10 seconds in milliseconds
    Loop
End Sub
It shows a procedure that once started will write an xlq formulae to A1 then continuously monitoring the value in cell A1, writing results based on the cell value to B1, and ending with a message box if certain criteria are reached.
For the example A1 contains =xlqFxStatic("xlqprice","BTC.USD[PAXOS,CRYPTO,USD]","ib"), i.e. the streaming real-time value for bitcoin. As xlqFxStatic is used the value will be updated every time at the start of the loop by CalculateFull
if =xlqPrice("BTC.USD[PAXOS,CRYPTO,USD]","ib") had been used the value would be updated in real-time while the macro was not running, but would not have updated while VBA was looping.
The macro loops again after a delay of 10 seconds. Sleep is used as it allows other excel processing to be performed. To exit the macro keep the escape key pressed until the Visual Basic 'Code execution has been interrupted' dialog is shown
The next example does the same as the above but allows for real-time updating from xlq (without xlqFxStatic) in the cells as well using the results in a process running on a timer
Dim Timer
Sub StartTimer()
    Sheets("Sheet1").Select
    Range("A1") = "=xlqPrice(""BTC.USD[PAXOS,CRYPTO,USD]"",""ib"")"
    Timer = DateAdd("s", 10, Time)
    Application.OnTime Timer, "CalledOnTime"
End Sub

Sub CalledOnTime()
    Dim Price As Double
    Price = Range("A1")
    If (Price < 31000) Then
        Range("B1") = "Below 31000"
    Else
        Range("B1") = "Above 31000"
    End If
    If (Price < 30000) Then
        MsgBox "Alert Low Reached"
    ElseIf (Price > 32000) Then
        MsgBox "Alert High Reached"
    Else
        Timer = DateAdd("s", 10, Time)
        Application.OnTime Timer, "CalledOnTime"

    End If
End Sub
This is not intended to be a complete reference but rather a short reference useful to xlq users.
if you would like something added let me know.
When xlq is running the following global shortcuts apply to the xlq data engine.
| Keys | Description | |
| Alt-Ctrl-Shift-Q | Shows Q toolbar menu
or right click Q on task bar |
|
| Alt-Ctrl-Shift-S | Shows xlq status view
or right click Q, choose view data/ status |
|
| Alt-Ctrl-Shift-E |
Shows xlq2 EODHD view
or right click Q, choose view data/ EOD Historical Data |
|
| Alt-Ctrl-Shift-F |
Shows xlq2 FMP view
or right click Q, choose view data/ Financial Modeling Prep |
|
| Alt-Ctrl-Shift-N |
Shows xlq2 Norgate Data view
or right click Q, choose view data/ Norgate Data |
|
| Alt-Ctrl-Shift-C |
Shows the Schwab secure signin view
or right click Q, choose Preferences / data source specific / Schwab and click the ...button next to secure login |
|
| Alt-Ctrl-Shift-R |
Shows the Tradier secure signin view
or right click Q, choose Preferences / data source specific / Tradier and click the ...button next to secure login |
|
| Alt-Ctrl-Shift-P |
Shows the Portfolio view
or right click Q, choose View data / Portfolio |
|
| Alt-Ctrl-Shift-Z |
Re-request account / portfolio data from brokers
or from the Portfolio view click the cloud / arrow icon. |
|
| Alt-Ctrl-Shift-X | Force a total refresh of all xlq data in excel | |
| Double click Q icon |
Shows xlq Stock Manager
or right click Q, choose Stock Manager |
|
| Ctrl-Q |
When using the authentication views to sign in with a broker, pressing ctrl-Q will force the focus from the dialog window to the browser content / web page .
(useful if using a screen reader or working without a mouse). |
|
Standard Excel Shortcuts.
| Keys | Description | |
| F2 or double click |
Edit a cell | |
| Shift F2 | Insert / Edit comment in cell | |
| Shift F3 | Opens Excel's Fx Dialog Box | |
| Ctrl F3 | Opens Name Manager | |
| F4 |
Toggless absolute / relative cell references when editiing
if not repeats last command or action |
|
| Shift F5 or Ctrl H |
Opens Find / Replace Dialog | |
| Alt F8 | Opens Macro Dialog | |
| F9 |
While editing replaces formula with result
if not recalculates workbook Shift-F9 recalculates only current sheet Alt-Ctrl-F9 Full recalculate Alt-Ctrl-Shift-F9 Full recalculate with dependancy rebuild |
|
| Alt F11 |
Open Visual Basic Editor
If already open, toggles between excel and editor |
|
| Ctrl 1 |
Open Excel's Formatting dialog
Ctrl-Shift-! Format as number with 2 decimals and thousands seperator Ctrl-Shift-# Format cell as date |
|
| Ctrl V | Paste (Ctrl-C = Copy / Ctrl-X = Cut) | |
| Alt Ctrl V |
Advanced Paste dialog
Alt-Ctrl-V-V to quickly paste as values |
|
| Ctrl Z | Undo | |
| Ctrl Space |
Select column
Ctrl-Shift-Space will select worksheet |
|
| Ctrl ' | Copy formula from cell above | |
| Ctrl ; |
Enter current date into cell
ctrl-Shift-: will enter time |
|
| Ctrl ¬ |
Toggles showing formulae / values
usually key next to 1 |
|
| Alt = | Autosum a column | |
| Ctrl Shift = | Insert column or row | |
| Alt M V | Evaluate selected formula | |
| Alt M X |
Change Excel Calculation Option
Alt-M-X-A - Set to automatic Alt-M-X-M - Set to manual If set to manual do not forget to back to automatic if not cells will not update automatically... |
|
Since Excel 2013, Excel's user interface is an SDI (single document interface) that runs in the same instance of excel, i.e. even though each workbook has it's own window there is only 1 program running managing the windows, updates sharing data and settings.
Compared to earlier versions of excel which used an MDI (multiple document interface), where all workbooks were shown in the same window as sub windows, the design offers more flexibility in terms of positioning windows, working with multiple monitors etc. In earlier versions in order to work with 2 separate windows, 2 separate running instances of excel were needed. This meant each version was independent, i.e. no data or settings are shared, changes to 1 does not change the other, workbooks cannot interact etc.
As each workbook already has it's own window, many users do not realize that it is still possible to work with multiple instances of excel with recent versions, i.e. have certain workbook running in 1 copy of excel, and others in another.
For general purposes there is no need to use multiple instances but sometimes there are advantages e.g.
- When a connection to xlq is made in excel it applies to the instance and all workbooks will now share the connection, and only once the last workbook is closed will the connection end. Sometimes however you may want to have excel and xlq running perhaps doing some long processing or applying many calculations but want to work in another non xlq workbook doing different calculations and not have excel recalculate due to real-time market data etc.
- Or you may be working with non xlq workbooks and need to quickly view an xlq workbook but do not want to keep a connection to xlq open once consulting it.
- Or you are running lengthy VBA processes in one instance which is blocking user interaction, and using another instance to continue working with other workbooks.
- Or you have certain xlq workbooks requiring streaming real-time updates, and others working on historic analysis that do not require regular updating. You can open 2 instances and change the update frequency for each.
- You may also prefer separate instances to keep other add ins, dde connections or rtd servers apart.
- If using 32 bit excel each instance is limited to 3GB. if using multiple workbooks exceeds the limit, you can avoid the problem by opening each in its own instance (64bit excel does not have this limit)
Whatever the reason to have excel start a new instance, once the first is already running, keep the Alt key pressed (until the new instance dialog is shown) while starting a new of excel
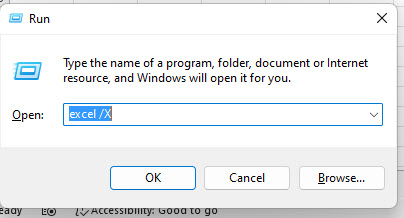
Alternatively press the Windows start key + R to show the run command dialog, enter excel /X then click OK.
When using multiple instances of excel with xlq, they will all connect to the same instance of xlq, using the same market data, underling calculations and data feed connections.
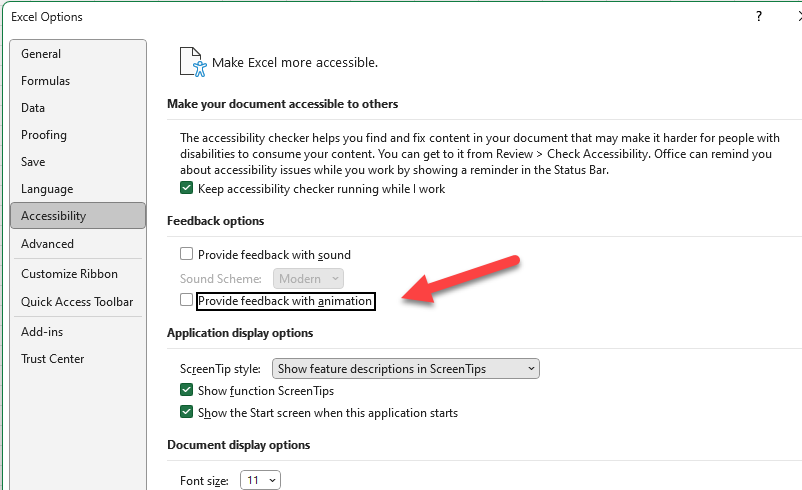
Since 2013 Excel may animate cell changes with a rolling effect similar to a split-flap display of an old Flight Information Display System. It may look fancy if there are only a couple of cells updating but can be annoying and even distracting when many cells change.
Excel usually reverts to 'normal' updating after some time, but it is possible to disable it completely.
This has been simplified in Microsoft 365. In excel choose Options, select Accessibility, and remove the check from "Provide feedback with animation", then click OK.
If using an older version of excel, if excel options / advanced has an option to "disable hardware graphics acceleration", check it and click OK.
You could also run regedit and add a 32bit DWORD value named DisableAnimations and set it to 1 under
Computer\HKEY_CURRENT_USER\Software\Microsoft\Office\16.0\Common\Graphics
You may need to add the key Graphics if it is not already defined., If using Office 2013, it would be 15.0, all newer versions use 16.0.
Another solution is to open windows accessibility settings (windows key + U), and under visual effects, turn off animation effects.
Every cell in excel will display its results based on the formatting applied. This not only covers the formatting of numbers and dates, but also the alignment (left, right, wrap, merge, orientation), the font, borders, coloring and even protection that has been applied.
Formatting never changes the underlying value, only what is seen.
Below will cover custom formatting. To understand the other possibilities, simplest is to open the format dialog (ctrl-1) and look through and apply the different settings to a cell, or range of cells to see the results
To create custom formatting you use the format dialog, choose the number tab and select custom. If a standard formatting almost covers what you want, you can select it, then choose custom with the template already applied for editing.
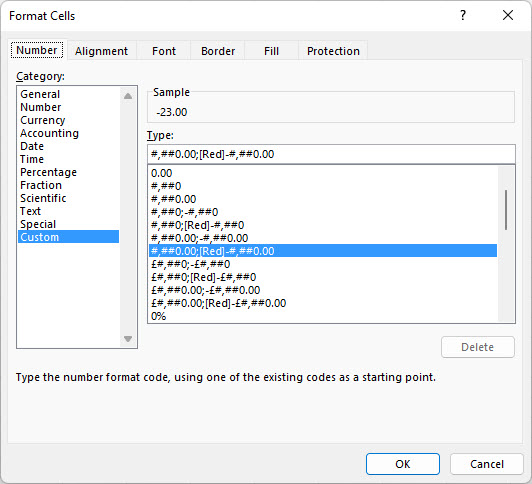
The template consist of 4 sections seperated by semicolons, i.e
Positive; Negative; Zero; Text
e.g. [Green]#,##0.00_);[Red](#,##0.00);"N/A";"error: "@
Based on the above, if the value was positive it would be shown in green, with 2
decimals, a padded space to align with negatives, and if the value was greater than 1000 would include a
separator, i.e. 12 would be 12.00, and 1234 would be 1,234.00
if negative, would be shown in red and within brackets -12 would be (12.00) etc.
if 0 would show N/A instead
and if value was text, it would be prefixed with error:
| Code | Description | |
| General | i.e. usually just as entered | |
| 0 | Always show number even if 0 | |
| # | Show number but not extra 0's | |
| ? | Shows number or pad with space if 0 | |
| . (point) | Decimal point | |
| , (comma) | Thousands separator | |
| % | Multiply by 100 and show % | |
| / | Shows value as fraction | |
| E | Scientific notation | |
| _ (underscore) | indent by following character, usually_( or _) | |
| @ | Display text | |
| "" | Add text within the quotes | |
| \ | display following character | |
| * (asterisk) | repeats following character | |
| [] |
color / conditional
default colors include Black, White, Green, Blue, Magenta, Yellow, Cyan, Red |
|
| $+-(){}<>=:^!~/(space) | These character may be entered without quotes | |
| Formatting | Value | Result |
| ###.# | 1 123.4 123.45 12345.6 |
1. 123.4 123.5 12345.6 |
| 000.0 | 1 | 001.0 |
| ???.??? | 1 | 1. |
| #,##0.00;[Red]-#,##0.00 | 1 -1234.5 |
1.00 -1,234.50 |
| #,##0.00%;[Red]-#,##0.00% | 1 -0.123 |
100.00% -12.30% |
| # ???/??? | 123.25 1.7 |
123 1/4 1 7/10 |
| 0.00E+00 #0.0E+0 |
12345.67 12345.67 |
1.23E+04 1.2E+4 |
| [Green]#,##0.00_);[Red](#,##0.00);- | 123.4 -1234.5 0 |
-123.40 (1,234.50) - |
| [Green]\U;[Red]\D;; | 1 -1 0 text |
U D <empty cell> <empty cell> |
| [Green]"↑ "#,##0.00;[Red]"↓ "-#,##0.00;[Blue]"===";[Red]@ | 1 -2 0 text |
↑ 1.00 ↓ -2.00 === text |
| #*+;*-# | 1 -1 |
1++++++++++ ----------------1 |
| '[Red][<-25]"!!! "0.0;[Green][>=-20]0.0;0.0 | -26 -22 -20 |
!!! -26.0 -22.0 -20.0 |
| Date / Time | Description | |
| d | Day (without leading 0) | |
| dd | Day (with leading 0) | |
| ddd | Day abbreviated as Mon, Tue etc. | |
| dddd | Day in full as Monday, Tuesday etc. | |
| m | Month (without leading 0) | |
| mm | Month (with leading 0) | |
| mmm | Month abbreviated as Jan, Feb etc. | |
| mmmm | Month in full as January, February etc. | |
| mmmmm | Month as first letter J, F etc. | |
| yy | Year shown as 2 digits | |
| yyyy | Year shown as 4 digits | |
| h | Hour (without leading 0) | |
| hh | Hour (with leading 0) | |
| [h] | Elapsed Time in hours (may exceed 24) | |
| m | Minute (without leading 0) | |
| mm | Minute (with leading 0) | |
| [m] | Elapsed time in minutes (may exceed 60) | |
| s | Second (without leading 0) | |
| ss | Second (with leading 0) | |
| ss.0 | Second with fraction (millisecond = ss.000) | |
| [s] | Elapsed time in Seconds (may exceed 60) | |
| AM/PM |
12 hour clock along with AM or PM alternatives am/pm, A/P and a/p |
|
| ,-/: etc. | For additional formatting | |
| [$-XXX] |
Force specific locale e.g.
[$-en-US] - English - United States [$-en-UK] - English - United Kingdom [$-fr-FR] - French - France [$-de-DE] - German - Germany [$-zh-CN] - Chinese (simplified) - China [$-x-sysdate] - as per windows configurtion More from Microsoft |
|
| Formatting | Value | Result |
| d dd ddd dddd [$-fr-FR]dddd |
2 January 2022 i.e. cell value 44563 |
2 02 Sun Sunday dimanche |
| m mm mmm mmmm [$-fr-FR]mmmm mmmmm |
2 January 2022 i.e. cell value 44563 |
1 01 Jan January janvier J |
| d-m-y mm-dd-yy yyyy/mm/dd ddd dd mmmm yyyy hh:mm:ss General |
2 January 2022 i.e. cell value 44563 |
2-1-22 01-02-22 2022/01/02 Sun 02 January 2022 00:00:00 44563 |
| dd-mmmm hh:mm:ss d m hh:mm:ss.000 |
2 January 2022 15:15:45 i.e. cell value 44,563.635938 milliseconds apply only to IQFeed |
02-Jan 15:15:45 2 1 15:15:45.000 |
| mm/dd/yy hh:mm:ss AM/PM h:m a/p h am/pm |
2 January 2022 15:15:45 i.e. cell value 44,563.635938 |
01/02/22 03:15:45 PM 3:15 p 3 pm |
| [h] "hours" [m] "minutes" [sssssssss] "sec" |
2.5 i.e. range of 2.5 days |
60 hours 3600 minutes 000216000 sec |
 dd-mmm-yy;; or dd-mmm-yy;; or dd-mmm-yy;;"-" etc. Specify value for 0 date to only show valid dates |
44563 0 0 |
02-Jan-22 <empty cell> - |
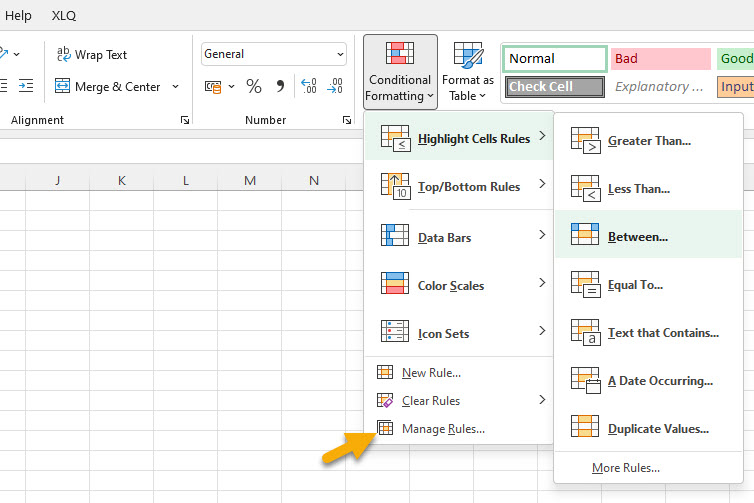
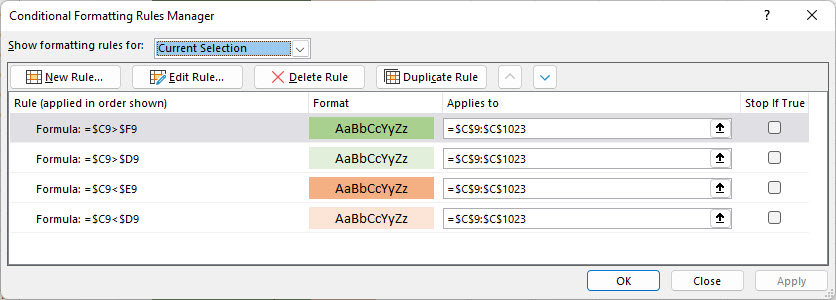
In addition to cell formatting mentioned above it is possible to further customize a cells contents with conditional formatting, i.e. standard cell formatting applies the formatting based on the value of the cell itself, whereas conditional formatting allows you to format the cell differently depending on the value or based on other cells values uses multiple conditions. Common uses are to color code values to highlight higher / lower values. But it is possible to do a lot more including differentiating days of the week or alerting to price ranges and or showing cross overs. Showing triggers such as buy or sell alerts or trailing stops
To use conditional formatting you select the cells and choose conditional formatting from the menu
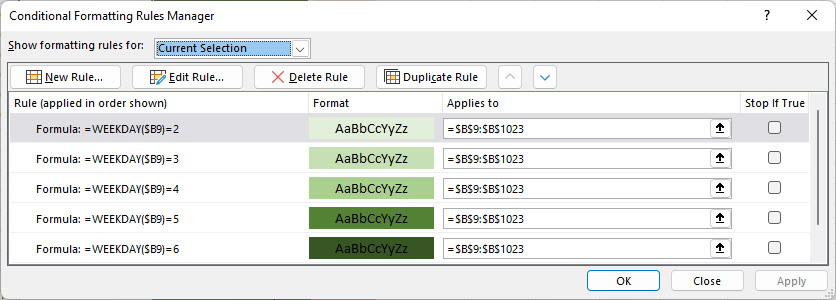
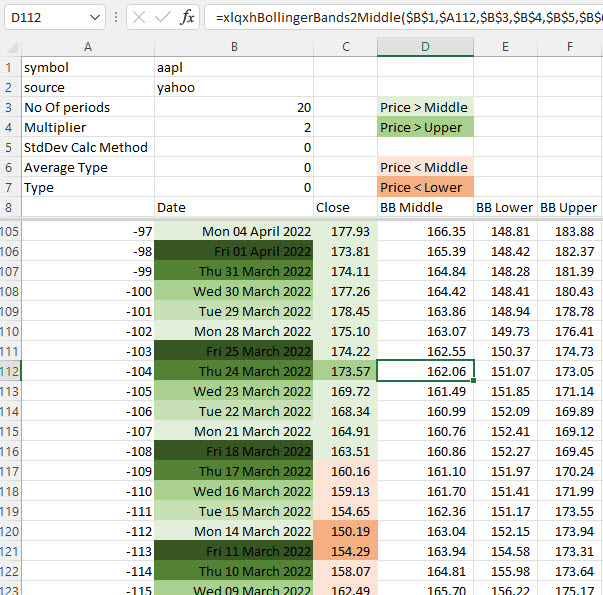
The below example shows each day of the week in a different color and further shows the price in different colors if it is above or below the Bollinger Band middle value and further highlights if the value crosses over the Upper or Lower Band
Excel includes conditional formulae allowing for results to be retuned depending on the logic applied.
The simplest is to use =if() which has the following parameters =if(logic to check, result if true, result if false).
In its most simplest form, you could use
=IF(TRUE,1,"no") which would return 1, and =IF(FALSE,1,"no") which will return no
The conditional test which needs to result in true or false, can include any logic such as =, <, > <=, >=, <> or formulae such as NOT, AND, OR etc.
=IF(xlqPrice("msft") < 100, "Alert","") for example will show Alert if the price is less than 100 and an empty cell otherwise. The formula may also be
referenced in another cell e.g. A1 < 100.
=IF(xlqPrice("msft")>xlqhClose("msft",-1),xlqPrice("msft"),IF(xlqhClose("msft",-1)>xlqhClose("msft",-2),xlqhClose("msft",-1),xlqhClose("msft",-2)))
return last price if greater than last close, otherwise the greater of the last and prior close.
When Needing to test multiple conditions you can use AND
=IF(AND(A1>A2,A2>A3,A3>A4),"All Greater","no")
using OR instead would have retuned true if 1 value was greater.
IFS is an alternative that tests multiple conditions and will return the result of the first that is true, and #N/A if all are false. The above nested if could be re-written as
=IFS(xlqPrice("msft")>xlqhClose("msft",-1),xlqPrice("msft"),xlqhClose("msft",-1)>xlqhClose("msft",-2),xlqhClose("msft",-1),TRUE,xlqhClose("msft",-2))
There are also certain formulae that combine with IF such as SUMIF, AVERAGEIF, COUNTIF or IFS (SUMIFS, AVERAGEIFS, COUNTIFS) to return the result based on the condition, e.g.
=SUMIF(A1:A10,">2") will sum the values in a1 to 10 only if greater than 2
If the 3rd parameter was added
=SUMIF(A1:A10,">2",B1:B10) the values in B will be
summed based on the condition in A.
Excel also has various IS.. formulae that return true or false to be used with IF such as
- ISBLANK is cell empty
- ISERR - any excel error except #N/A
- ISERROR - any excel error
- ISLOGICAL - is TRUE or FALSE
- ISNA - is excel #N/A (not xlq)
- ISNONTEXT - return true if number or empty cell
- ISNUMBER - true if number
- ISREF - is a valid cell reference
- ISTEXT - true if text
XLQ errors differ from excel errors as xlq errors will always be text (allowing for additional detail
to be provided with the error such as invalid source etc.) and
cannot be used with ISERR or ISERROR instead you may check for any
using the IS text formulae
e.g. =xlqPrice("junksymbol") will return #N/A as text so =ISERROR(xlqPrice("junksymbol")) will return false but the error can be trapped using =ISTEXT(xlqPrice("junksymbol")) as all valid values will be a number.
However if the formula is part of a calculation as in =xlqPrice("junksymbol")*10, excel will return #VALUE! as you are multiplying text with 10 and this can be trapped with ISERROR and not ISTEXT.
In this case
=IF(ISTEXT(xlqPrice(A1,"yahoo")),xlqPrice(B1,"xlq2"),xlqPrice(A1,"yahoo"))
if the symbol is invalid for the source, you can specify a different symbol with a different source
To use ISERROR you could use the following (multiply by 1)
=IF(ISERROR(xlqPrice(A1,"yahoo")*1),xlqPrice(B1,"xlq2"),xlqPrice(A1,"yahoo"))
IFERROR returns the result if true, or an alternative if false and allows it to be further simplified as
=IFERROR(xlqPrice(A1,"yahoo")*1,xlqPrice(B1,"xlq2"))
Excel Tables provide a quick and easy method to group common data, allowing for working with a range of cells as a collection.
Once a table is defined it is possible to sort on columns, apply filters to the data, include total calculations etc.
The quickest way to create a table is to select the range of cells with the mouse, then press ctrl-T (it is also possible to choose "Format as Table" from the excel menu.
Once the table is created it is possible to choose the formatting and to give it a name for quick reference.
The below example converts a range returning data for the dow jones into a table and shows some basic possibilities of sorting and filtering.
Right click within the table to quickly insert or delete rows / columns. Edit an xlq formula or calculation n a cell and the change is applied to the whole column.
To quickly add a row select the bottom right cell, then press tab, a new row is added with all formulae pre-filled, in this case requiring only the new symbol to be entered. You may also click the handle and drag it to expand the table adding multiple rows and / or columns
From the excel Table Design menu or right clicking you may toggle the total row where you may choose the sum / average / max / min / stddev etc.
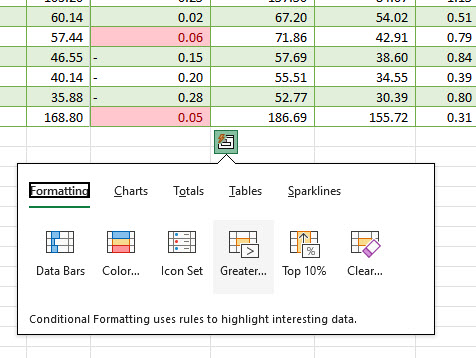
Select a column then choose Quick Analysis from the right click menu, or click the icon to choose various options, such as conditional formatting etc.
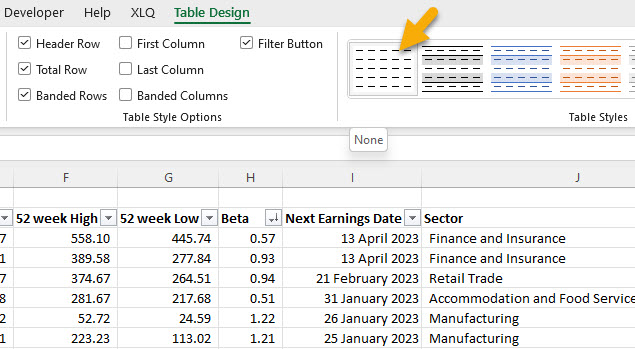
If you no longer want the data to be represented as a table you may choose "convert to range" from the excel menu or right click menu / table. Doing so removes the table but not the formatting.
To remove formatting ensure you have selected none as the formatting choice before hand.
New Tips and Tricks Page
- A quick reference guide to using xlq2 with excel including shortcuts, tips etc.
- Examples and explanations for all user levels.
Also available via the Resource menu above, along with references for formulae, symbols etc.
LATEST NEWS:
24 March 2026
XLQ2 26.1.2 released
-
Schwab Account portfolio and event data
new formulae
new portfolio view
new sample spreadsheet -
VWAP (Volume Weighted Average Price)
available for all sources supporting historic intraday.
-
Historic Intraday Real-Time CSV
Updated in realtime as bars complete.
-
Historic Market Cap Data
from EODHD and FMP.
-
Historic Open Interest Data
for futures from Norgate Data.
-
Draw Down / Up Dates
Also available for intraday returning date and time.
-
Stochastic RSI
The stochastic RSI (StochRSI) calculation is now available.
- More. >>
Current Offers
1 year of upgrades included
Purchase xlq2Lite for $159
Purchase xlq2 for $299
Pleased with the service and support
or feel extra has been earned?
Your acknowledgement is appreciated.
Thank you
User Comments
It is so uncommon in this day and age to receive top-level, human support and I appreciate that immensely. The quality, breadth and utility of your product is incredible, but even more impressive is the level of support you provided to me, just one individual customer. You may quote me on that. Thank you.
- C.B.
Wow, you did a lot of work on this version. New interface and other things as well. I must give you credit for being the most responsive software engineer that I've ever encountered. Every question that I've sent you over the many years (since 2003!!!) has been answered quickly and professionally. I just wanted to let you know that it is appreciated.
- M.N.
I have to say Leo that the last two versions have made some tremendous improvements to what has been for years an outstanding application. Thank you for your continued efforts.
- C.A.
Just to let you know that, the new version works much better & faster than the older one. I like it a lot, fantastic job you did!!!
- R.S.
Many thanks indeed for your clear and very rapid reply. I am not used to this type of quality service - I thought it went out of fashion years ago !!
- P.G.
In only 40 some days XLQ has helped me with a number of research projects I couldn't possibly have done without it and I'm now using it to help manage and track current trades and to alert me to potential new trades.
- D.P.
I just wanted to take a moment and thank you for creating XLQ. I use it regularly for scanning/monitoring securities in Excel 2007. I have programmed in trailing stops for securities I own and numerous techniques using indicators for securities on my watch list. The combination of Excel 2007 and XLQ has opened up nearly an unlimited capability that is only constrained by my imagination.
- E.H.
Thank you for the amazing package -- I use it daily and it's ridiculously useful! Others (.....) have added some of the features you have, but none of them even comes close to matching what you've built.
- R.B.
Your product is fantastic, amazing, and really strong. It has real enabling capability. Thank you for putting this into the market!
- R.G.
You have an exceptional customer service, you have always answered my questions, I thank you for that, made it really easy to use this software, will be your long term customer. Thanks.
- A.D.
I was halfway resigned to have to program something like this myself. Only it would have taken me forever, and I couldn't have done it half as well. Thanks!
- M.S.
I also want to thank you for making the XLQ program. It is something that is very useful and incredible helpful. Like it was made for my needs.
- J.T.
I have already modified your demo sheet to fit my needs. Your program allows me to turn my excel spreadsheet into a total information center that updates automatically. It's elegant.
- W.H.
First, I want to say that your program is probably the finest piece of work I have ever seen. The depth is simply amazing. Congratulations and thanks.
- D.B.
Thanx, Leo. You're a great sport. By the way, partially because of the application of xlq in my screen, I have passed 30% up in the market this year!!!!
- B.H.
This is a wonderful product -- simple to use and just plain useful!
- C.B.
I want to say you have created THE ULTIMATE data interface software for traders like me who prefer to use Excel for everything. Thanks a bunch.
- M.Y.
I just wanted to say, that I very much like your xlq package. I have tried many similar products and this is by far the best I have come across. Simple, fuss-free setup, integrates well with Excel, and has its own stand alone interface to track your portfolio throughout the day. Since I am from Europe, and trade US, European and Japanese securities, the ability to use a variety of feeds simultaneously and transparently is particularly valuable to me.
- H.S.
I really appreciate your quick responses. And your program is terrific. The Plus version adds a lot with it‘s AAII interface. I’ll definitely register it since in the last week it has become an indispensable part of my stock analysis.
- R.S.
I found XLQ yesterday afternoon – and I am blown away by how useful it is. You really need to market this thing because it is AWESOME!!!
- D.B.
Your explanation was very good. I understand now and find it very useful. If you always reply so quickly to questions, I will have to believe that you supply the best and fastest support of any software company.
- D.H.
I have “dabbled” for several years creating many of the things you present in this great program. I first began using the “*.iqy” external query (update times horrendous), then Excel VBA and lately attempting to learn “C” or “C++” in order to have smoother, faster updates as well as a great appearing “front end”. Your program certainly is, by far, the leader and has the greater edge over any I have seen, or tried to accomplish. Thank you for such a great program.
- R.H.
You are a very special person to reply so quickly and I want to thank you again. I enjoy your program. It gives me everything I need, and I know there is so much more functionality that I'm not even exploiting.
- F.D.
I love your program. XLQ combined with the power of Excel brings limitless possibilities to manipulate data for better trading. I recommend it to everyone I know interested in trading.
- P.S.
Thanks for such a great program. I have no programming experience and was trying to find a way to do just what you have done. Only you did much more. It’s fantastic and reasonably priced too!
- D.T.
Thank you so much for your help and your phenomenal programming. XLQ is awesome.
- T.K.
I use your XLQ product all the time. Some of the best money I've ever spent on software.
- L.S.
First, a thank you for the excellent and useful adjunct to EXCEL. I seem to discover a new use every day – and I’m sure I haven’t even scratched the surface to utilize XLQ’s full potential. The new version is really great.
- W.H.
First let me say that I feel XLQ is terrific. I really appreciate the versatility you have made possible with this package. I have set up a few worksheets and find it easy to learn and use with the aid of the included demo sheets. This application has the potential in my opinion to be unmatched in power, efficiency and productivity.
- C.A.
Your software is on its way to becoming the only window that I need to the market’s numbers. With the ability to arrange thing EXACTLY the way I want them, and the use of conditional formatting to trigger alarms and display changes to suit my needs, I am gradually replacing all of the other market tools I’ve been using. I can’t be a more enthusiastic supporter of what you are doing. Thanks.
- W.G.
I'm wowed by your software!! I used to enter data in my spreadsheet for two hours for each update, and therefore only did it once or twice a week. Now I do it with the close each day - in about 30 seconds!!! And I've added some data points to help with my analysis that I just could not manage to maintain before. Thanks again for a great program, a great deal, and great support!!!!!
- R.K.
Your software is great. I'm hooked on the info I can generate for stock purchasing and selling using your program. In two weeks I've become an XLQ junkie.
- V.D.
Please let me tell you how much I have come to depend on XLQ in a short period. This is a great product!! You have made my job significantly more streamlined, and my tasks simpler and more elegant. Many, many thanks!
- L.D.
I have been evaluating XLQ for the past few weeks and am thoroughly impressed with the product. It is versatile, easy to use, accurate and very intuitive. It is a real bargain compared to competitive products plus it runs right from within Excel. Based on this I just entered my purchase order.
- M.M.
I ADORE your program. It has really helped me to learn about how the markets work, and building my own system indicator by indicator is the best way to learn.
- B.K.
Leo: count me as a satisfied customer. I gave it a good workout for a month, decided to buy it when it saved me 5 hours of administration the first week, and helped me do some studies I had been postponing for months due to slow data retrieval. Your product is smooth, fast and elegant with a very clean presentation. Well done!
- K.L.
The more I work with XLQ, the more I like it. It is fast! And so rich... I like it so much I have decided to adopt it as my #1 tool for the long term.
- S.C.
Thanks very much for writing XLQ - I like it very much as it gives me the opportunity to manipulate data as I want without a very steep learning curve.
- T.B.
I just downloaded a trial of XLQ and have been "playing" with it for hours. I am so impressed. I wish I would have known about your program years ago.
- D.F.
I just purchased your software and think it is the next best thing since the spreadsheet.
- R.D.
Thanks for the best (and least complicated) investing software out there!!
- F.B.
Your software is simply brilliant, for the last week that I have been trying it, I have been impressed no end.
- G.R.
Thanks, Xlq is a great piece of software, its actually saving me a heap of time and time is the precious commodity in these hectic days.
- J.P.
The XLQ interface with Excel is excellent. I have been waiting for this capability for years.
- H.A.
Please accept my thanks for your wonderful product - it is a pleasure to use.
- D.L.
Your software is just what I have needed. It provides me with the capability to customize data and construct charts which give me the views I like - not just what someone thinks I would like.
- D.E.
Firstly, let me say that the philosophy and idea behind XLQ is exactly what I am looking for.
- S.P.
The more I use XLQ the more I appreciate what can be done with it.
- S.M.
Just like to say, excellent work. A potentially good bit of software for me.
- M.C.
I love your product so far. ... Thank you for making such product available.
- A.T.
Thanks for the Tip. You know, your program is really super.
- P.B.
Great software! Simple, elegant, well-thought-out and fast.
- R.M.
I am always finding new ways to use your program in my investment / speculative Market endeavors.
- S.S
Thanks for such a wonderful product. It certainly does handle my most precious need which is to monitor the market realtime..
- W.B
It is a pleasure doing business with such a responsive person who obviously understands the value of good customer service. I have just registered and intend to make good use of this program.
- E.D.
Your fast and thorough answer is more than what I expected. Your service is awesome and your product is very stable. Keep up with your good work. Sincerely appreciated :)
- V.P.
Just a note to let you know that I really like you software. It's a wonderful interface that has been of great utility to me.
- J.B.
Join the XLQ2 Users Group
Books
xlq2 has been recommended in the following:
Van Tharp
Paul King
QMatix
Copyright © 2000 - 2026 Leo van Rijswijk | All Rights Reserved.