 If you would like to contact Leo or have a support question, please use this form, or send an email to
These formulae have been superseded by the more powerful historic intraday formulae, which also allow for:
- Working with multiple time intervals (specified in the formulae).
- Work with months of data (depending on source) including historic and / or current day / realtime updating .
- Reference data by date / time or relative reference.
- Work with market hours only and / or include pre/post market.
- All calculation formulae have been ported
- Range formulae are also available
- New view with intraday by date allowing for multiple intervals.
For more information click here
Introduction
Intraday formulae allow you to work with historic tick or X minute bars of data.
Backfill data will automatically be requested from the streaming source (IB, IQFeed and Tradier) and updated from the streams. Intraday data will also be logged from snapshot services.
Intraday formulae will work on the frequency set in xlq preferences. Only when an X minute interval is chosen can xlqxi.. calculations be performed.
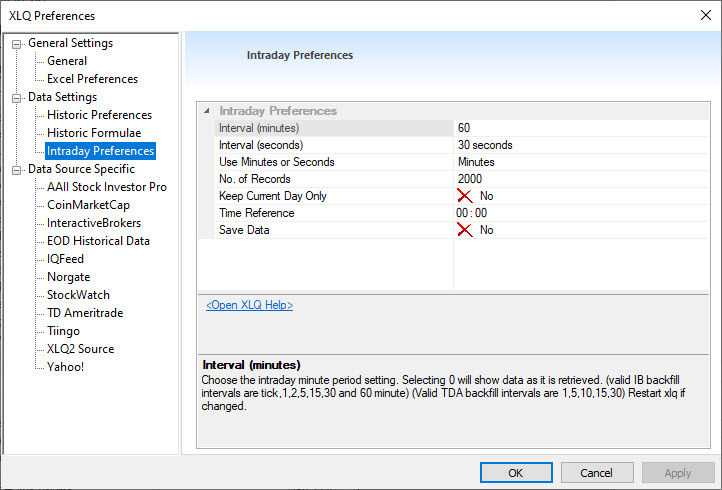
If the preference setting is changed xlq should be restarted to work with the new interval. From the data source specific preferences it is also possible to set source specific backfill settings such as restricting the backfill to certain times, or including only regular trading hours.
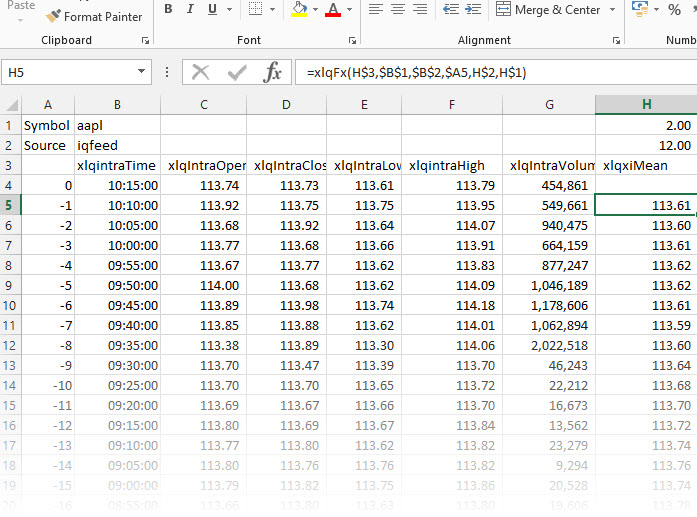
Formulae returning basic data start with xlqIntra and require a sequence parameter. Calculated formulae start with xlqxi.. and may require additional parameters.
Sequence
All intraday formulae require a sequence parameter being a value starting from 0 (most recent), -1, -2 till -2000 (oldest).
Depending on the preference setting they could represent ticks or x minute bars, e.g. if a 5 minute bar is chosen, 0 would be the current 5 minute bar, -1 the 5 minute before, -2 the 5 minutes before that.
List
| xlqIntra | Description | xlq2Lite | xlq2 | |
| Time | Time of the start of the x minute interval, or time of tick | |||
| Price | Price of current tick, or price at end of x minute period | |||
| Size | Size of trade, or size of last trade in x minute period | |||
| Bid | Bid, or last bid in x minute period | |||
| Ask | Ask, or last ask in X minute period | |||
| BidSize | Size of Bid, or size of last bid in x minute period | |||
| AskSize | Size of Ask, or size of last ask in x minute period | |||
| Change | change since the previous intraday sequence | |||
| Volume | Volume of shares traded since the previous intraday sequence | |||
| TotalVolume | the total shares traded at the time of the intraday transaction | |||
| Open | Opening price for the interval | |||
| Close | Closing price for the interval | |||
| Low | Low for the interval | |||
| High | High for the interval | |||
| EarliestPeriod | the earliest -x reference for the intraday series | |||
| xlqxi.. Averages | Description | xlq2Lite | xlq2 | |
| StdDev | returns the standard deviation (for sample) over X periods. May be calculated on different Types | |||
| StdDevP | returns the standard deviation (for population) over X periods. May be calculated on different Types | |||
| Mean | returns a simple moving average for X periods. May be calculated on different Types | |||
| SMA | Simple moving average of close based on parameter | |||
| EMA | Exponential moving average of close based on parameter | |||
| AveVolume | simple moving average of volume based on parameter | |||
| AveVolumeEMA | Exponential moving average of volume based on parameter | |||
| FlexAve | Type of average and Type of data used depend on parameters | |||
| FlexAveSlope | Slope of FlexAve, can specify alternate No. of Periods than for Average | |||
| FlexAveIntercept | Intercept of FlexAve, as per Slope | |||
| FlexAveStdDev | Standard Deviation (sample) of Average | |||
| FlexAveStdDevP | Standard Deviation (population) of Average | |||
| xlqxi.. Calculations | Description | xlq2Lite | xlq2 | |
| AveRange | (14) period Average of the Range | |||
| AveRangeEMA | Exponential Moving Average of the Range | |||
| AveTrueRange | (14) period Average of the True Range | |||
| AveTrueRange2 | weighted (Wilder) Average of the True Range | |||
| AveTrueRangeEMA | Exponential Moving Average of the True Range | |||
| ATRPercent | an X period Average (sma) True Range as a % of the last close for the range. The result is also available as a Type parameter for other formulae | |||
| SMATP | Simple Moving Average of the Typical Price | |||
| RateOfReturn | (close – X period prior close) / X period prior close *100 | |||
| Streak | returns the number of consecutive up or down periods, xlqxh.. May be calculated on different Types | |||
| PercentRank | returns the percentile rank over the specified periods (default 100). May be calculated on different Types | |||
| Aroon | ||||
| AroonUp | Aroon Up based on high | |||
| Aroon Down | Aroon Down based on low | |||
| Aroon Oscillator | Difference between Aroon Up and Down | |||
| ADX (Average Directional Index) | ||||
| DMIPositive | The Positive Directional Movement Indicator i.e. an ema of the directional indicator (i.e. ema of DM+ / ema of True Range). | |||
| DMINegative | The Negative Directional Movement Indicator i.e. an ema of the directional indicator (i.e. ema of DM- / ema of True Range). | |||
| DX | The Directional Index i.e. (abs(DMI+ - DMI-)) / (DMI+ + DMI-) * 100 | |||
| ADX | The Average Directional Index i.e. an ema of the DX. | |||
| Balance Of Power | ||||
| BalanceOfPower | Balance Of Power indicator uses price to measure buying and selling pressure. | |||
| Bollinger Bands | xlq2Lite | xlq2 | ||
| BollingerBandsUpper | The Upper band of the BB calculation. The default is 20 periods with stddev multiplier of 2, and may be calculated on different Types | |||
| BollingerBandsMiddle | The Middle band of the BB calculation. Fractional Mulipliers may be used | |||
| BollingerBandsLower | The Lower band of the BB calculation. | |||
| BollingerBandsB | The %B Bollinger Bands calculation. | |||
| BollingerBandsWidth | The bandwidth of the BB calculation. | |||
|
Note: multiplier is entered as an integer but
fractions may be entered as follows:
values over 10 will be divided by 10, e.g. 21 will be 2.1 values over 100 will remove 100 and divide by 10, i.e. 121 will be 2.1 109 will be .9 values over 1000 will remove 1000 and divide by 100 i.e. 1210 will be 2.1, 1215 will be 2.15 |
||||
| Bollinger Bands Version 2 with extra parameters | xlq2Lite | xlq2 | ||
| BollingerBands2Upper | The Upper band of the BB calculation. The default is 20 periods with stddev multiplier of 2, and may be calculated on different Types | |||
| BollingerBands2Middle | The Middle band of the BB calculation. Fractional Mulipliers may be used | |||
| BollingerBands2Lower | The Lower band of the BB calculation. | |||
| BollingerBands2B | The %B Bollinger Bands calculation. | |||
| BollingerBands2Width | The bandwidth of the BB calculation. | |||
|
Note: multiplier is entered as an integer but
fractions may be entered as follows:
values over 10 will be divided by 10, e.g. 21 will be 2.1 values over 100 will remove 100 and divide by 10, i.e. 121 will be 2.1 109 will be .9 values over 1000 will remove 1000 and divide by 100 i.e. 1210 will be 2.1, 1215 will be 2.15 |
||||
| CCI (Commodity Channel Index) | ||||
| SMATPMD | mean deviation of the SMATP (sma of typical price) | |||
| CCI | The Commodity Channel Index | |||
| Chaikin Money Flow | ||||
| ChaikinMoneyFlow | Chaikin Money Flow Index. | |||
| ChaikinMoneyFlowMultiplier | Multiplier of the Chaikin Money Flow. | |||
| ChaikinMoneyFlowVolume | Volume of the Chaikin Money Flow. | |||
| Choppiness Index | ||||
| Chop | Choppiness Index indicates whether the market is trending (not choppy) or ranging (choppy). | |||
| CMB Composite Index | ||||
| CMBComposite | CMB (Constance Brown) Composite Index. | |||
| CMBCompositeFast | Fast SMA of the CMB Composite Index. | |||
| CMBCompositeSlow | Slow SMA of the CMB Composite Index. | |||
| Connors RSI | ||||
| ConnorsRSI | Connors Relative Strength Index. Default RSI periods = 3, RSI Streak Periods = 2, Percent Rank periods = 100. | |||
| ReverseConnorsRSI | returns the price required to obtain the target Connors RSI. Requires the number of periods for the rsi, the streak rsi the Percent Rank and the CRSI target. The Target should be entered as an integer. e.g. 60. If you would like to enter 60.5 use 605, or for 2 decimals 6055 for 60.55 | |||
| FVE (Finite Volume Elements) | ||||
| FVE | returns the FVE | |||
| FVEAverage | returns the average of the FVE | |||
| FVESlope | returns the slope of the FVE | |||
| Force Index | ||||
| ForceIndex | returns the Force index (default uses a 13 period ema) | |||
| Fractal Dimension Index | ||||
| FractalDimension | returns the Fractal Dimension Index (usually 30 periods) | |||
| Historic Volatility | xlq2Lite | xlq2 | ||
| HistoricVolatility | returns the historic volatility. The default being for 30 periods and an annualized (252 day) scale factor. | |||
| Kaufman Efficiency Ratio | ||||
| KaufmanER | Kaufman Efficiency Ratio. The default is 10 periods, and may be calculated on various Types | |||
| Keltner Channels | ||||
| KeltnerChannelsLower | Returns the lower Keltner Channel. Default 20 Periods, 10 ATR periods, multiplier of 2, using an EMA
Fractional multipliers may be used - see BollingerBands for an example |
|||
| KeltnerChannelsMiddle | Returns the middle Keltner Channel. | |||
| KeltnerChannelsUpper | Returns the upper Keltner Channel. | |||
| Keltner Channels Version 2 with extra parameters | ||||
| KeltnerChannels2Lower | Returns the lower Keltner Channel. Default 20 Periods, 10 ATR periods, multiplier of 2, using an EMA
Fractional multipliers may be used - see BollingerBands for an example |
|||
| KeltnerChannels2Middle | Returns the middle Keltner Channel. | |||
| KeltnerChannels2Upper | Returns the upper Keltner Channel. | |||
| LSMA (Least Square Moving Average) also known as the linear regression value, moving linear regression and regression oscillator. | ||||
| LSMA | Least Square Moving Average. May be calculated on various Types | |||
| Slope | Slope used in the LSMA | |||
| MaxLSMA | Returns the Max of Least Square Moving Average for all periods between the 2 period ranges specified. The LSMA will be calculated for each and the maximum value for each result is returned | |||
| MACD (Moving Average Convergence - Divergence) | xlq2Lite | xlq2 | ||
| MACD | MACD (usually 26 / 12 period) | |||
| MACDTrigger | X period EMA of MACD (default 9) | |||
| MACDHistogram | Difference between MACD and MACDTrigger | |||
| MACD (Moving Average Convergence - Divergence) Version 2 with extra parameters | ||||
| MACD2 | MACD2 (usually 26 / 12 period) | |||
| MACD2Trigger | X period EMA of MACD (default 9) | |||
| MACD2Histogram | Difference between MACD and MACDTrigger | |||
| Money Flow Index | ||||
| MoneyFlowRatio | Money Flow Ratio | |||
| MoneyFlowIndex | Money Flow Index | |||
| On Balance Volume (OBV) | ||||
| OnBalanceVolume | On Balance Volume | |||
| PSAR (Parabolic Stop and Reverse) | ||||
| PSAR | Parabolic SAR (Stop and Reverse) Default acceleration factor 2% (.02), maximum step 20% (.2) | |||
| PSARLongShort | If long, return 1, if short returns -1 | |||
| PPO (Percentage Price Oscillator) | ||||
| PPO | the PPO (Percentage Price Oscillator) (usually 26 / 12 period) | |||
| PPOTrigger | X period EMA of PPO (default 9) | |||
| PPOHistogram | Difference between PPO and PPOTrigger | |||
| RSI (Relative Strength Index) | ||||
| AveGain | Average of Gains over X periods | |||
| AveLoss | Average of Losses over X periods | |||
| RelativeStrength | Relative Strength, i.e. AveGain / AveLoss | |||
| RSI | Relative Strength Index, i.e. RelativeStrength as a value between 0 and 100. | |||
| ReverseRSI | the Reverse RSI, i.e. returns the price required to obtain the specified RSI. Requires no. of periods and target RSI. The Target should be entered as an integer. e.g. 60. If you would like to enter 60.5 use 605, or for 2 decimals 6055 for 60.55 | |||
| RSI (Relative Strength Index) Version 2 with extra parameters | ||||
| AveGain2 | Average of Gains over X periods | |||
| AveLoss2 | Average of Losses over X periods | |||
| RelativeStrength2 | Relative Strength, i.e. AveGain / AveLoss | |||
| RSI2 | Relative Strength Index, i.e. RelativeStrength as a value between 0 and 100. | |||
| Stochastic Oscillator | xlq2Lite | xlq2 | ||
| StochasticFastK | Stochastic %K (fast) for the x period (default 14) | |||
| StochasticFastD | Stochastic %D (fast) the y period SMA of the stochastic %K (fast) (default 3) | |||
| StochasticSlowK | Stochastic %K (slow) i.e. 3 period sma of the %K fast | |||
| StochasticSlowD | Stochastic %D (slow) i.e. the y period moving average of the stochastic %K (slow) (default 3) | |||
| StochasticFullK | Stochastic %K (full) i.e. y period sma of the %K fast | |||
| StochasticFullD | Stochastic %D (full i.e. the z period moving average of the stochastic %K (full) (default 3) | |||
| Super Trend | ||||
| SuperTrend | Super Trend by Olivier Seban. Can choose ATR calculation method | |||
| TRIX (Triple eXponential moving average) | ||||
| TrixDbMA | the partial calculation of the Trix, i.e the double EMA or the EMA of the first EMA. | |||
| TrixTrMA | the partial calculation of the Trix, i.e. the Triple EMA or the EMA of the double EMA. | |||
| Trix | the Triple EMA (usually 15 period) | |||
| TrixTrigger | X period EMA of Trix (default 9) | |||
| TrixHistogram | Difference between Trix and TrixTrigger | |||
| True Strength Index | ||||
| TrueStrengthIndex | the True Strength Index. | |||
| TrueStrengthSignal | X period EMA of True Strength Index . | |||
| TrueStrengthHistogram | Difference between Index and Signal. | |||
| Up Down Volume Ratio | ||||
| UDVR | the Up Down Volume Ratio. | |||
| UDVRSlope | Slope of the the Up Down Volume Ratio. | |||
| Vortex Indicator | ||||
| VortexPositive | the trend of the positive vortex (usually 14 period) | |||
| VortexNegative | the trend of the negative vortex (usually 14 period) | |||
| Williams %R Momentum Indicator | ||||
| WilliamsR | Williams %R Momentum Indicator (default 14) | |||
| Description | xlq2Lite | xlq2 | ||
Types
For any formula using a Type parameter, the following are available:
| 0 | Close |
| 1 | Open |
| 2 | Low |
| 3 | High |
| 4 | Typical Price i.e. (high + low + close) / 3 |
| 5 | Weighted Price i.e. (open + high + low + close) / 4 |
| 6 | Rate of Return (%Change) |
| 7 | Range i.e. High - Low |
| 8 | True Range |
| 9 | ATR%, i.e. x period ATR as specified in preferences as a % of the last periods close |
| 10 | CLOP (close - open) |
| 11 | CLOP% (close - open)/open |
| 12 | HIOP (high - open) |
| 13 | HIOP% (high - open)/open |
| 14 | LOOP (low - open) |
| 15 | LOOP% (low - open)/open |
| 16 | CLLO (close - low) |
| 17 | CLLO% (close - low) / low |
| 18 | CLHI (close - high) |
| 19 | CLHI% (close - high) / high |
| 20 | Volume |
| 21 | On Balance Volume |
| 22 | Close Price * Volume |
Flex Average Types
The Following Types may be used for the Flex. Average, Slope, Intercept and StdDev:
| 0 | SMA (Simple Moving Average) |
| 1 | EMA (Exponential Moving Average) |
| 2 | DEMA (Double Exponential Moving Average) |
| 3 | TEMA (Triple Exponential Moving Average) |
| 4 | TrEMA (Triangular Exponential Moving Average) |
| 5 | Wilder Moving Average |
| 6 | Weighted Moving Average |
| 7 | Volume Weighted Moving Average |
| 8 | Hull Moving Average |
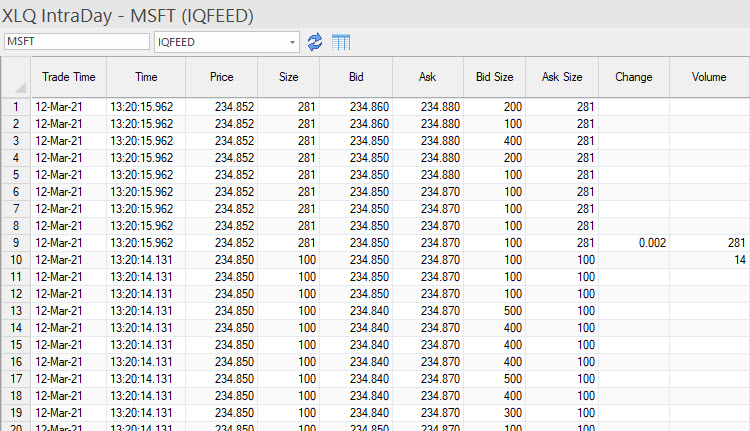
XLQ view
It is also possible to view the streaming data directly in xlq
Right click the Q on the task bar (or press alt-ctrl-shift-Q) and choose View data / Intraday View
Examples
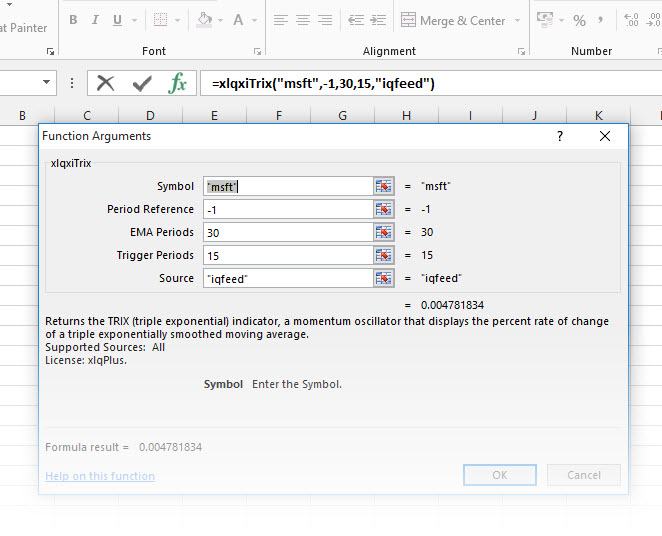
For additional information on parameters press excel's insert function button 'fx' and select the parameter
Streaming Tick Example
=If xlq preferences / Data settings / Intraday Preferences / Interval is set to 0, the intraday will show the historic of the stream
=xlqintraBid("gs",-1,"tradier") or =xlqfx("xlqintraBid","gs","tradier",-1)
5 minute bar example
=If xlq preferences / Data settings / Intraday Preferences / Interval is set to 5, the intraday will show the historic of the 5 minute bars
=xlqxiMean("msft",-1,12,2,"iqfeed") or =xlqFx("xlqxiMean","msft","iqfeed",-1,12,2)
will return a simple moving average or the low for the last 12 5 minute bars for Microsoft.
Additional examples of all formulae in xlqDemo.xls included with the download.
New Tips and Tricks Page
- A quick reference guide to using xlq2 with excel including shortcuts, tips etc.
- Examples and explanations for all user levels.
Also available via the Resource menu above, along with references for formulae, symbols etc.
LATEST NEWS:
2 July 2026
XLQ2 26.2 released
-
InteractiveBrokers Account and portfolio data
-
Major technical update
- More. >>
Current Offers
1 year of upgrades included
Purchase xlq2Lite for $159
Purchase xlq2 for $299
Up to $50 off for a limited time - see 25 years offer.
Pleased with the service and support
or feel extra has been earned?
Your acknowledgement is appreciated.
Thank you
User Comments
It is so uncommon in this day and age to receive top-level, human support and I appreciate that immensely. The quality, breadth and utility of your product is incredible, but even more impressive is the level of support you provided to me, just one individual customer. You may quote me on that. Thank you.
- C.B.
Wow, you did a lot of work on this version. New interface and other things as well. I must give you credit for being the most responsive software engineer that I've ever encountered. Every question that I've sent you over the many years (since 2003!!!) has been answered quickly and professionally. I just wanted to let you know that it is appreciated.
- M.N.
I have to say Leo that the last two versions have made some tremendous improvements to what has been for years an outstanding application. Thank you for your continued efforts.
- C.A.
Just to let you know that, the new version works much better & faster than the older one. I like it a lot, fantastic job you did!!!
- R.S.
Many thanks indeed for your clear and very rapid reply. I am not used to this type of quality service - I thought it went out of fashion years ago !!
- P.G.
In only 40 some days XLQ has helped me with a number of research projects I couldn't possibly have done without it and I'm now using it to help manage and track current trades and to alert me to potential new trades.
- D.P.
I just wanted to take a moment and thank you for creating XLQ. I use it regularly for scanning/monitoring securities in Excel 2007. I have programmed in trailing stops for securities I own and numerous techniques using indicators for securities on my watch list. The combination of Excel 2007 and XLQ has opened up nearly an unlimited capability that is only constrained by my imagination.
- E.H.
Thank you for the amazing package -- I use it daily and it's ridiculously useful! Others (.....) have added some of the features you have, but none of them even comes close to matching what you've built.
- R.B.
Your product is fantastic, amazing, and really strong. It has real enabling capability. Thank you for putting this into the market!
- R.G.
You have an exceptional customer service, you have always answered my questions, I thank you for that, made it really easy to use this software, will be your long term customer. Thanks.
- A.D.
I was halfway resigned to have to program something like this myself. Only it would have taken me forever, and I couldn't have done it half as well. Thanks!
- M.S.
I also want to thank you for making the XLQ program. It is something that is very useful and incredible helpful. Like it was made for my needs.
- J.T.
I have already modified your demo sheet to fit my needs. Your program allows me to turn my excel spreadsheet into a total information center that updates automatically. It's elegant.
- W.H.
First, I want to say that your program is probably the finest piece of work I have ever seen. The depth is simply amazing. Congratulations and thanks.
- D.B.
Thanx, Leo. You're a great sport. By the way, partially because of the application of xlq in my screen, I have passed 30% up in the market this year!!!!
- B.H.
This is a wonderful product -- simple to use and just plain useful!
- C.B.
I want to say you have created THE ULTIMATE data interface software for traders like me who prefer to use Excel for everything. Thanks a bunch.
- M.Y.
I just wanted to say, that I very much like your xlq package. I have tried many similar products and this is by far the best I have come across. Simple, fuss-free setup, integrates well with Excel, and has its own stand alone interface to track your portfolio throughout the day. Since I am from Europe, and trade US, European and Japanese securities, the ability to use a variety of feeds simultaneously and transparently is particularly valuable to me.
- H.S.
I really appreciate your quick responses. And your program is terrific. The Plus version adds a lot with it‘s AAII interface. I’ll definitely register it since in the last week it has become an indispensable part of my stock analysis.
- R.S.
I found XLQ yesterday afternoon – and I am blown away by how useful it is. You really need to market this thing because it is AWESOME!!!
- D.B.
Your explanation was very good. I understand now and find it very useful. If you always reply so quickly to questions, I will have to believe that you supply the best and fastest support of any software company.
- D.H.
I have “dabbled” for several years creating many of the things you present in this great program. I first began using the “*.iqy” external query (update times horrendous), then Excel VBA and lately attempting to learn “C” or “C++” in order to have smoother, faster updates as well as a great appearing “front end”. Your program certainly is, by far, the leader and has the greater edge over any I have seen, or tried to accomplish. Thank you for such a great program.
- R.H.
You are a very special person to reply so quickly and I want to thank you again. I enjoy your program. It gives me everything I need, and I know there is so much more functionality that I'm not even exploiting.
- F.D.
I love your program. XLQ combined with the power of Excel brings limitless possibilities to manipulate data for better trading. I recommend it to everyone I know interested in trading.
- P.S.
Thanks for such a great program. I have no programming experience and was trying to find a way to do just what you have done. Only you did much more. It’s fantastic and reasonably priced too!
- D.T.
Thank you so much for your help and your phenomenal programming. XLQ is awesome.
- T.K.
I use your XLQ product all the time. Some of the best money I've ever spent on software.
- L.S.
First, a thank you for the excellent and useful adjunct to EXCEL. I seem to discover a new use every day – and I’m sure I haven’t even scratched the surface to utilize XLQ’s full potential. The new version is really great.
- W.H.
First let me say that I feel XLQ is terrific. I really appreciate the versatility you have made possible with this package. I have set up a few worksheets and find it easy to learn and use with the aid of the included demo sheets. This application has the potential in my opinion to be unmatched in power, efficiency and productivity.
- C.A.
Your software is on its way to becoming the only window that I need to the market’s numbers. With the ability to arrange thing EXACTLY the way I want them, and the use of conditional formatting to trigger alarms and display changes to suit my needs, I am gradually replacing all of the other market tools I’ve been using. I can’t be a more enthusiastic supporter of what you are doing. Thanks.
- W.G.
I'm wowed by your software!! I used to enter data in my spreadsheet for two hours for each update, and therefore only did it once or twice a week. Now I do it with the close each day - in about 30 seconds!!! And I've added some data points to help with my analysis that I just could not manage to maintain before. Thanks again for a great program, a great deal, and great support!!!!!
- R.K.
Your software is great. I'm hooked on the info I can generate for stock purchasing and selling using your program. In two weeks I've become an XLQ junkie.
- V.D.
Please let me tell you how much I have come to depend on XLQ in a short period. This is a great product!! You have made my job significantly more streamlined, and my tasks simpler and more elegant. Many, many thanks!
- L.D.
I have been evaluating XLQ for the past few weeks and am thoroughly impressed with the product. It is versatile, easy to use, accurate and very intuitive. It is a real bargain compared to competitive products plus it runs right from within Excel. Based on this I just entered my purchase order.
- M.M.
I ADORE your program. It has really helped me to learn about how the markets work, and building my own system indicator by indicator is the best way to learn.
- B.K.
Leo: count me as a satisfied customer. I gave it a good workout for a month, decided to buy it when it saved me 5 hours of administration the first week, and helped me do some studies I had been postponing for months due to slow data retrieval. Your product is smooth, fast and elegant with a very clean presentation. Well done!
- K.L.
The more I work with XLQ, the more I like it. It is fast! And so rich... I like it so much I have decided to adopt it as my #1 tool for the long term.
- S.C.
Thanks very much for writing XLQ - I like it very much as it gives me the opportunity to manipulate data as I want without a very steep learning curve.
- T.B.
I just downloaded a trial of XLQ and have been "playing" with it for hours. I am so impressed. I wish I would have known about your program years ago.
- D.F.
I just purchased your software and think it is the next best thing since the spreadsheet.
- R.D.
Thanks for the best (and least complicated) investing software out there!!
- F.B.
Your software is simply brilliant, for the last week that I have been trying it, I have been impressed no end.
- G.R.
Thanks, Xlq is a great piece of software, its actually saving me a heap of time and time is the precious commodity in these hectic days.
- J.P.
The XLQ interface with Excel is excellent. I have been waiting for this capability for years.
- H.A.
Please accept my thanks for your wonderful product - it is a pleasure to use.
- D.L.
Your software is just what I have needed. It provides me with the capability to customize data and construct charts which give me the views I like - not just what someone thinks I would like.
- D.E.
Firstly, let me say that the philosophy and idea behind XLQ is exactly what I am looking for.
- S.P.
The more I use XLQ the more I appreciate what can be done with it.
- S.M.
Just like to say, excellent work. A potentially good bit of software for me.
- M.C.
I love your product so far. ... Thank you for making such product available.
- A.T.
Thanks for the Tip. You know, your program is really super.
- P.B.
Great software! Simple, elegant, well-thought-out and fast.
- R.M.
I am always finding new ways to use your program in my investment / speculative Market endeavors.
- S.S
Thanks for such a wonderful product. It certainly does handle my most precious need which is to monitor the market realtime..
- W.B
It is a pleasure doing business with such a responsive person who obviously understands the value of good customer service. I have just registered and intend to make good use of this program.
- E.D.
Your fast and thorough answer is more than what I expected. Your service is awesome and your product is very stable. Keep up with your good work. Sincerely appreciated :)
- V.P.
Just a note to let you know that I really like you software. It's a wonderful interface that has been of great utility to me.
- J.B.
Join the XLQ2 Users Group
Books
xlq2 has been recommended in the following:
Van Tharp